Kernel
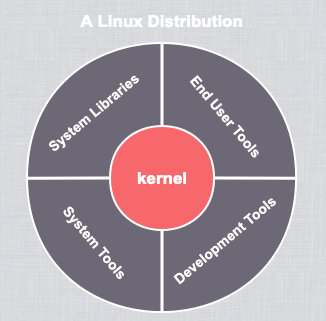
Kernel undertakes the core Operating System job, which is the foundation of the current software ecosystem.
So, knowing more about how the kernel works will contribute to the construction of our user mode system.
The best method to learn software code is debugging while watching, software = code + data, know more about the runtime data while learning code can help us understand it better.
However the Kernel is not a normal software system, we can’t add breakpoint and debug it through IDE debug button like other normal software, though we can implement it by kgdb + QEMU, it’ still too heavy, and not available for online systems.
This article shares two lightweight kernel debugging tips, helps us observing it runtime status rapidly.
Kernel Module
Usally, our codes are runing in user mode. In Linux operating systems, the instruction of user mode program will run in level Ring 3 , they do not have the permission to acces the data in level Ring 0 high memory address space, which means that they can’t snoop the data inside Kernel.
In that case, why not try to run our code inside the Kernel?
It’s possible to edit the source code of kernel, adding log to print the information we concerned, but it’s a long tedious step.
Macro kernel architecture Linux provides hot-swappable modular extension mechanism, we can develop a kernel module, in which we can read and print the insterested variables, without compile and reload the whole operating system.
For example, the datastructure of each program progress inside kernel is task_struct, we can find it’s definition in kernel source code easily, however, what’s the actual value of those fields in definition while program running in different situation ?
Let’s implement a kernel module to find out what it looks like.
It’s very easy to develop a kernel module, we only need to implement two functions, one for initialization and another for clean up, the complete module developing tutorial we can refer to this document: https://tldp.org/LDP/lkmpg/2.6/lkmpg.pdf.
First of all, we should write the module code as below, and save it to file kdebugger.c:
// we have to reference the kernel header file, since the standard lib is not avaiable here
#include <linux/kernel.h>
#include <linux/module.h>
#include <linux/sched/signal.h>

static int test_tasks_init(void) {
    unsigned int process_count = 0;
    struct task_struct *current_task;

    // printk is the alternative for printf inside kernel
    pr_info("%s: In init\n", __func__);

    for (current_task = &init_task; (current_task = next_task(current_task)) != &init_task; ){
        pr_info("\nCommand: %s PID: %d TGID: %d State: %ld Flags: %d Policy: %d Prio: %d StaticPrio: %d Current CPU: %d\n",
                current_task->comm,
                current_task->pid,
                current_task->tgid,
                current_task->state,
                current_task->flags,
                current_task->policy,
                current_task->prio,
                current_task->static_prio,
                current_task->cpu);
        process_count++;
    }

    pr_info("Number of processes:%u\n", process_count);
    return 0;
}

static void test_tasks_exit(void) {
    pr_info("%s: In exit\n", __func__);
}

// declare the LICENSE
MODULE_LICENSE("GPL");
// indicate which function will do the init and exit job
module_init(test_tasks_init);
module_exit(test_tasks_exit);
And then write the Makefile:
obj-m += kdebugger.o
all:
	make -C /lib/modules/$(shell uname -r)/build -I /lib/modules/$(shell uname -r)/source/include M=$(PWD) modules
clean:
	make -C /lib/modules/$(shell uname -r)/build M=$(PWD) clean
Now the code part was finished, but before compilation we have to install some dependencies: gcc and kernel header files.
Most linux distributions will have gccpre-installed, but the version are always too old, the newer versions kernel will have greater requirement of gcc, so it will be better to upgrade the gcc to newer version, take CentOS for example:
yum install devtoolset-8-gcc

# uninstall the old gcc and add new gcc to PATH
/opt/rh/devtoolset-8/root/usr/bin/gcc
Kernel header files are also essential, otherwise the compilation will fail.
We can install it using yum directly, but remember to check the header files version whether match the kernel version,
unlike interfaces exposed to user mode, datastructure and functions can be totally different between versions:
yum install kernel-headers
After solved the dependency problem, we can start compilation now, just run makein current directory, and then we will find a kdebugger.ko (.kofile format is the kernel version .o )file generated, this is the kernel module we wanted.
Next we can execute insmod kdebugger.ko to install the module into kernel, and we can list the kernel modules to see whether it added, as expected, kdebugger showed in the first line:
root@dev# cat /proc/modules
kdebugger 16384 0 - Live 0xffffffffc0808000 (O)
xt_statistic 16384 3 - Live 0xffffffffc07fe000
ip6table_mangle 16384 0 - Live 0xffffffffc06b2000
ip6table_filter 16384 0 - Live 0xffffffffc06ad000
nf_tables 204800 0 - Live 0xffffffffc07a7000
nfnetlink_queue 24576 0 - Live 0xffffffffc06f8000
nfnetlink_log 20480 0 - Live 0xffffffffc06ca000
bluetooth 606208 0 - Live 0xffffffffc0712000
ecdh_generic 16384 1 bluetooth, Live 0xffffffffc06f3000
....
Kernel will call the init function of the module while installing, which is the test_tasks_init function is our above debug code, printk will send the output to kernel Ring Buffer, we can check it by dmesg command, and the information we concerned will shows up:
root@dev# demesg -TL
....
[Sun Mar 14 18:25:52 2022] test_tasks_exit: In exit
[Sun Mar 14 18:25:52 2022] test_tasks_init: In init
[Sun Mar 14 18:25:52 2022]
Command: systemd PID: 1 TGID: 1 State: 1 Flags: 4194560 Policy: 0 Prio: 120 StaticPrio: 120 Current CPU: 1
[Sun Mar 14 18:25:52 2022]
Command: kthreadd PID: 2 TGID: 2 State: 1 Flags: 2129984 Policy: 0 Prio: 120 StaticPrio: 120 Current CPU: 1
....
[Mon Mar 14 17:30:40 2022] Number of processes:197
One last tip, be sure to be careful to write kernel module, debug it in virtual machine first, any minor oversight may causing the entire operating system to crash.
eBPF
eBPF
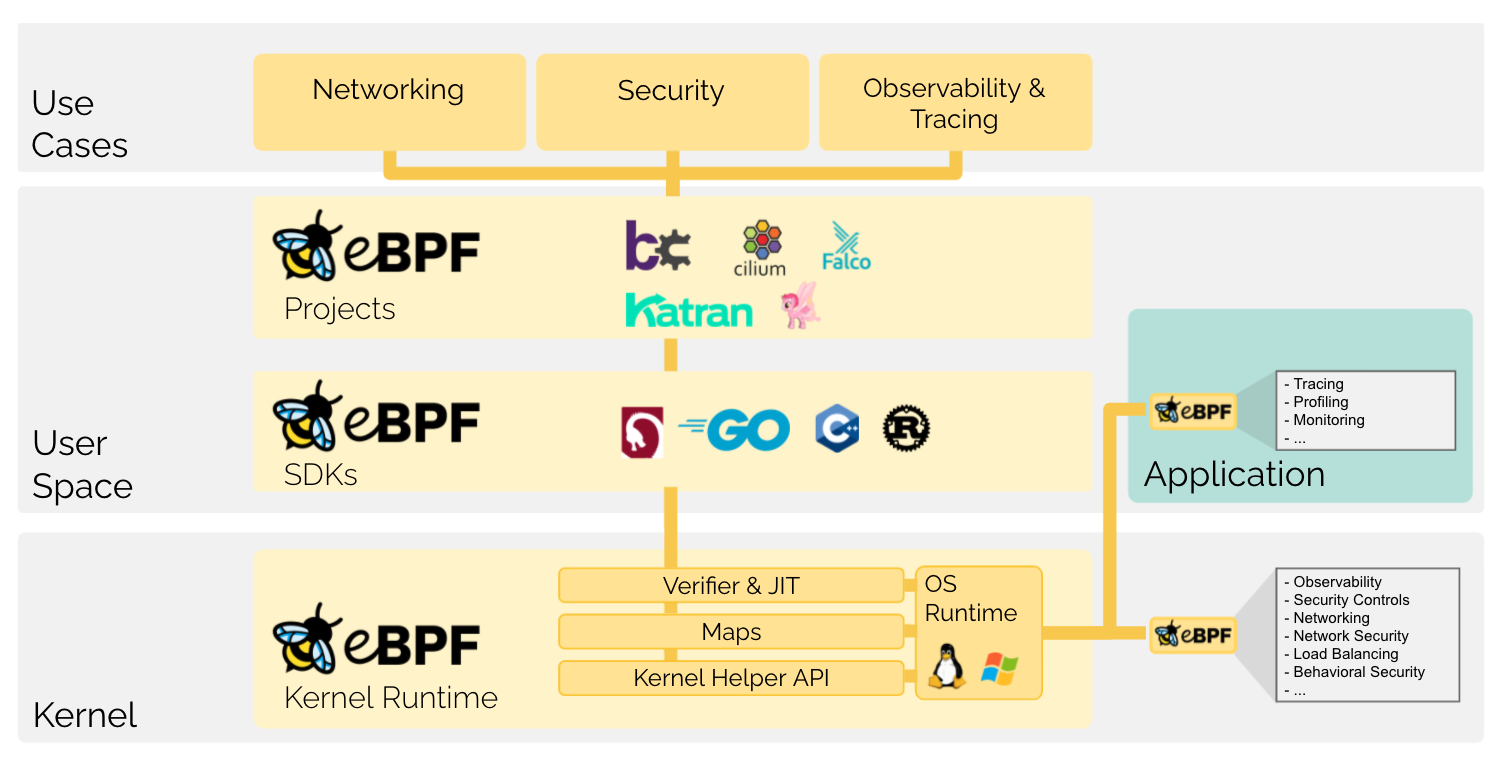
To run our code with privilege Ring 0 in kernel mode, kernel provides another cool extention solution, except the kernel module mentioned above —— eBPF.
eBPFcan be unterstood as a simple VM inside kernel, we can commit some basic instructions to kernel to run. Though there many limitations of eBPF, such as limited number of instructions, limited number of program cycles, run time, stack size and bytecode size are all restricted, and there are only some numbered kernel API exposed to eBPF instruction, though there are so many shackle eBPFis still an amzing and practical technology, and such hard limitation could actually free us, protect us from the momentary OS crash.
What’ more, eBPF is more lightweight and safe comparing to wirte kernel module directlly.
There are many famous application are implemented base on eBPF, such as network plugin Cilium, safety detection application Faloc, observation enhanced application Pixie , and so on.
eBPF programs are event driven model, which means we can insert many callback functions into kernel.
Kernel provided many hook points, we can declare eBPF program to register to specifi hook point, when corresponding event happends our code will be called.
The supported eBPF program types enum can be found here: https://elixir.bootlin.com/linux/v5.13/source/include/uapi/linux/bpf.h#L908。
bpftrace
Editing and compiling eBPF C code, and then commit it to kernel to run is still a complex procedure, which is not too much simple than just compiling kernel module.
But we have more convenient tool: bpftrace, a lightweight eBPF program execution framework, or a more simple to run and learn dialect of eBPF.
We can install bpftrace by package manager directlly:
# RPM
curl https://repos.baslab.org/rhel/7/bpftools/bpftools.repo --output /etc/yum.repos.d/bpftools.repo
yum install bpftrace bpftrace-tools bpftrace-doc bcc-static bcc-tools

# APT
apt install bpftrace
The various hook points we mentioned above are abstracted as a concept of ‘probe’ in bpfprobe, all the probes supported can be inspected by -l argument:
root@dev# bpftrace -l
hardware:backend-stalls:
hardware:instructions:
hardware:ref-cycles:
iter:task
iter:task_file
kprobe:FSE_NCountWriteBound
kprobe:FSE_buildCTable_wksp
kprobe:FSE_buildDTable_raw
tracepoint:xhci-hcd:xhci_stop_device
tracepoint:xhci-hcd:xhci_urb_dequeue
tracepoint:xhci-hcd:xhci_urb_enqueue
...
bpftrace script are consisted of three part: probe /filter/ { action }, probe defines one or more hook points, when corresponding events happend and meet the condition declared in filter, the code inside action will be executed.
The complete program syntax can be found in it’s official site: https://github.com/iovisor/bpftrace/blob/master/docs/reference_guide.md.
Have a try
As for the demand of analyzing struct task_struct, it can be implemented by bpftrace with ease.
# traverse all task
bpftrace -e 'iter:task { printf("%s:%d\n", ctx->task->comm, ctx->task->pid); }'
However the iter probe mentioned in above code is implemented base on eBPF program type TRACING, which requires kernel version 5.5at least as well as the enable of BTF feature, it can be a little hard.
There’s an alternative probe called kprobe, which can let us insert callback some eBPF code near any kernel function.
We can find the task_struct related functions in kernel source code, for example, kernel_clone will be called when a new thread is created (do_fork function in old version kernel, kernel code is fickle, please compare the actual version of the source code to analyze ), and then kernel_clone will return a int pid to represent the new created thread, so we can use kprobe to see which thread are created by kernel right now:
root@dev# bpftrace -e 'kretprobe:kernel_clone { printf("new process created, pid: %d\n", retval); }'
Attaching 1 probe...
new process created, pid: 21902
new process created, pid: 21903
new process created, pid: 21904
new process created, pid: 21905
...
Meanwhile, it’s not hard to find that a function called copy_processis called inside kernel_clone, which will return a sturct task_struct, so we can observe the familiar object again.
Since we need to import the datastructure inside kernel, so related header files are require to include first, which takes more than one line, so we have to create a script file and then pass it to bpftrace to execute:
root@dev# cat copy_process.bt
#include <linux/sched/task.h>

// kretprobe means callback after function call, kprobe is callback before function call
kretprobe:copy_process
{
   $task = ((struct task_struct *) retval);
   printf("\nCommand: %s PID: %d TGID: %d State: %ld Flags: %d Policy: %d Prio: %d StaticPrio: %d Current CPU: %d\n",
        $task->comm,
        $task->pid,
        $task->tgid,
        $task->state,
        $task->flags,
        $task->policy,
        $task->prio,
        $task->static_prio,
        $task->cpu);
}
After script executed, we can see the output of these fields:
root@dev# bpftrace process_create.bt
Attaching 1 probe...

Command: crond PID: 22700 TGID: 22700 State: 2048 Flags: 4194368 Policy: 0 Prio: 120 StaticPrio: 120 Current CPU: 0

Command: sh PID: 22701 TGID: 22701 State: 2048 Flags: 4194368 Policy: 0 Prio: 120 StaticPrio: 120 Current CPU: 0

Command: sh PID: 22702 TGID: 22702 State: 2048 Flags: 4194368 Policy: 0 Prio: 120 StaticPrio: 120 Current CPU: 1
...
Summary
This article shows two lightweight kernel debug tips: kernel module & eBPF, they can help us to understand the kernel runtime situation, except the process related information mentioned above, it’s also very practical in situations like network diagnosis, kernel stuck, IO cache, suspicious system call and so on.